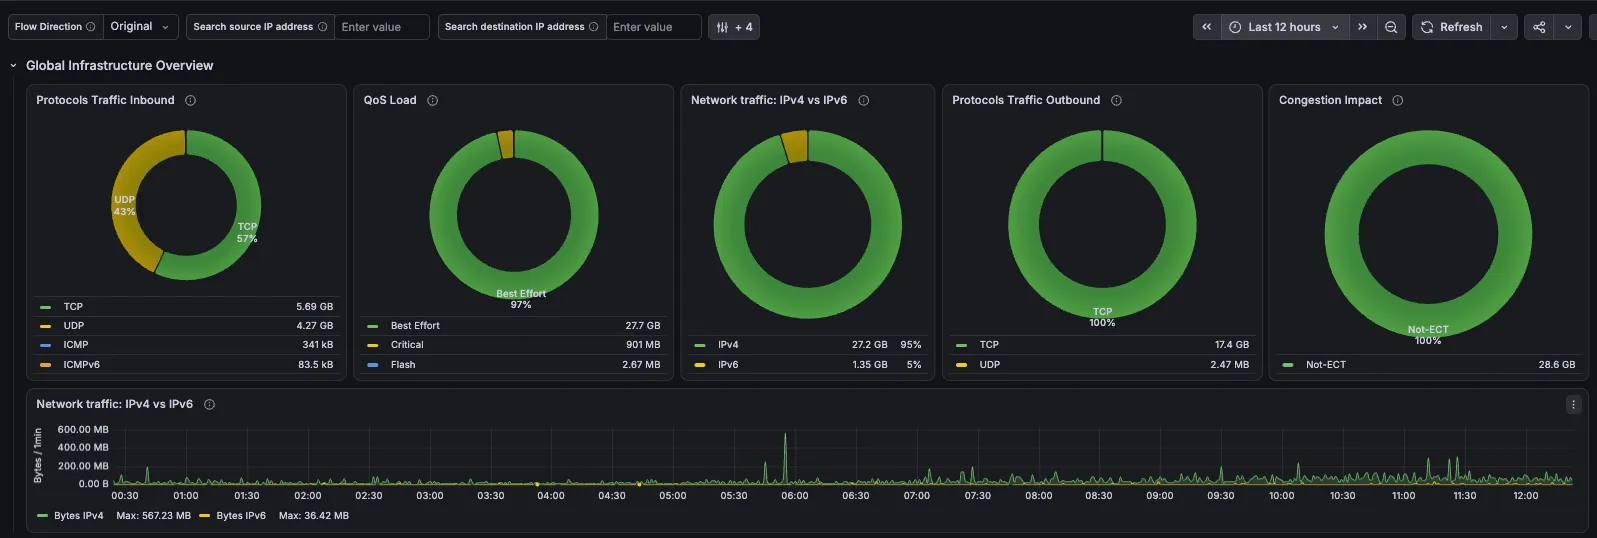
You get a working flow monitoring system in your own infrastructure or in the cloud: the collector, the database and the dashboards, connected to your network devices. It is based on my IPFIX monitoring stack. The public demo edition shows how it works; your deployment is set up for your network, your traffic and your security requirements.

What is included

  • Sizing of the host (CPU, memory, disk) for your traffic volume and retention period
  • Installation of the stack on your server or virtual machine
  • Onboarding of your exporters (routers, switches) and a check that flows arrive correctly
  • Access to Grafana for your team
  • Documentation of your setup and a handover

Who it is for

  • Anyone who wants an overview of what happens in their network, from a home or a small office to a large company
  • Companies that want to save money. When an attacker, an infected computer or something that wastes bandwidth shows up in the network, the monitoring visualises what is going on and where
  • Those who want to keep the data in-house, and those who prefer the cloud. I deploy both

How we work together

  1. You send me a short description of your network and what you need.
  2. We have a call and agree on scope, timeline and price.
  3. I do the work and keep you informed about progress.
  4. You get documentation of the result. Support can continue if you want.
  • IPFIX monitoring stack

    A self-contained Docker Compose stack for collecting, enriching and analysing network traffic from IPFIX/NetFlow exports.

    • IPFIX
    • NetFlow
    • IPFIXcol2
    • ClickHouse
    • Grafana
    • Docker

Need help with your network or monitoring?

Send me a short description of your network and what you need.