Problem

Routers and switches can export flow records (IPFIX or NetFlow): who talks to whom, on which ports, how much and when. To use them you need a collector, storage that can query millions of records quickly, and dashboards that make the data readable. Many small and medium networks have none of these, so the records are never collected.

What I built

A self-contained Docker Compose stack that collects, enriches and analyses network traffic from IPFIX/NetFlow exports.

  • Collection. The IPFIXcol2 collector receives IPFIX over UDP 4739 from a router or switch, or from the built-in synthetic traffic generator.
  • Storage and enrichment. Flows are stored in ClickHouse. At insert time each flow gets protocol names, traffic direction (internal, inbound, outbound), QoS priority, ECN and readable TCP flags.
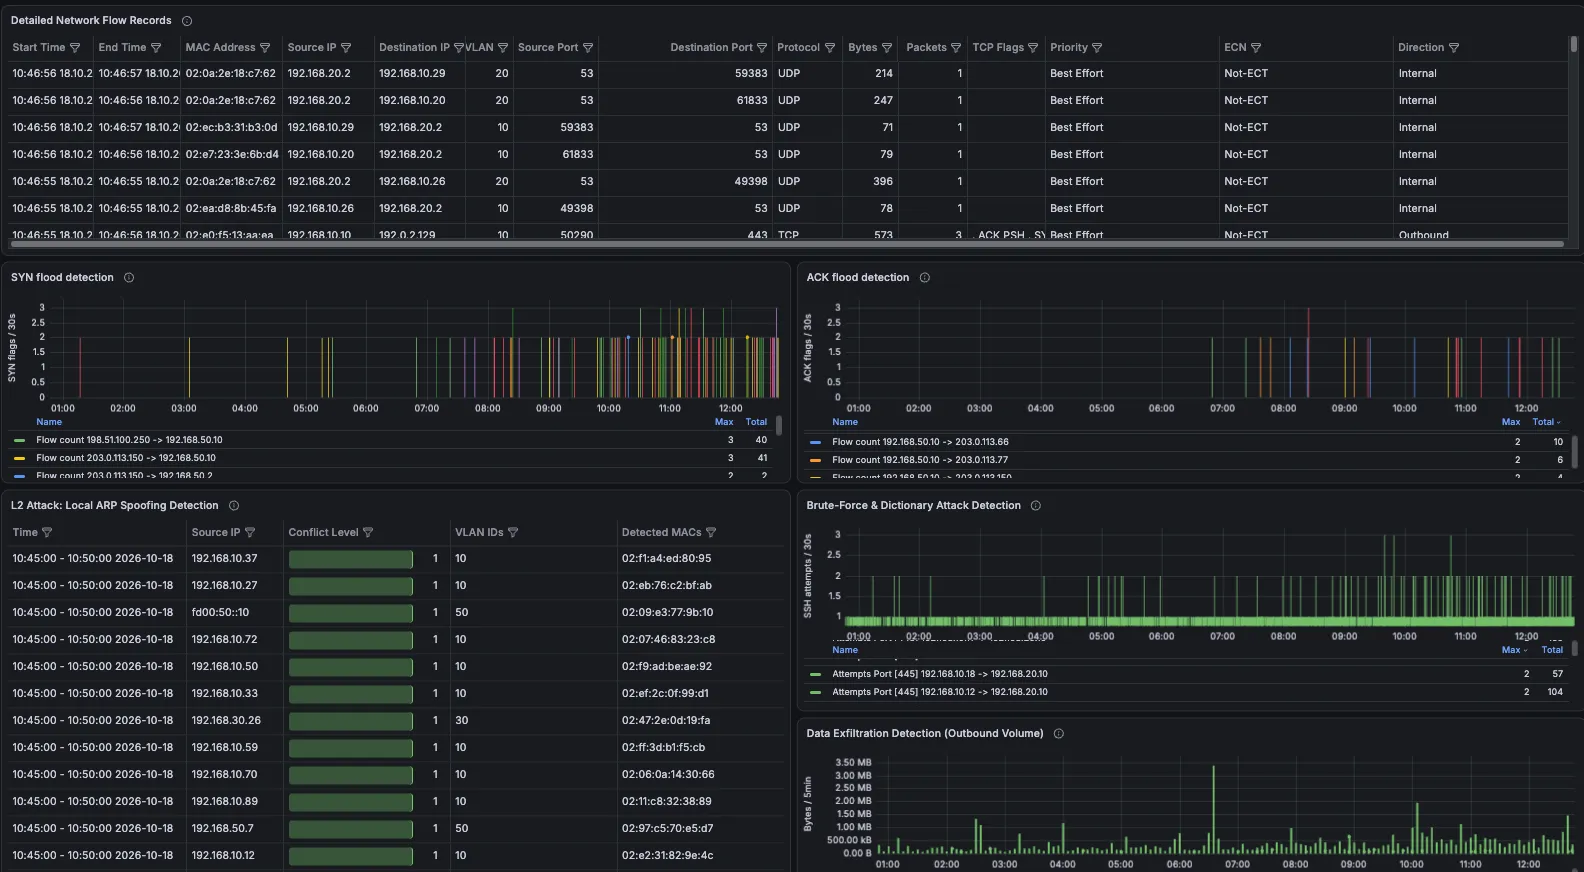
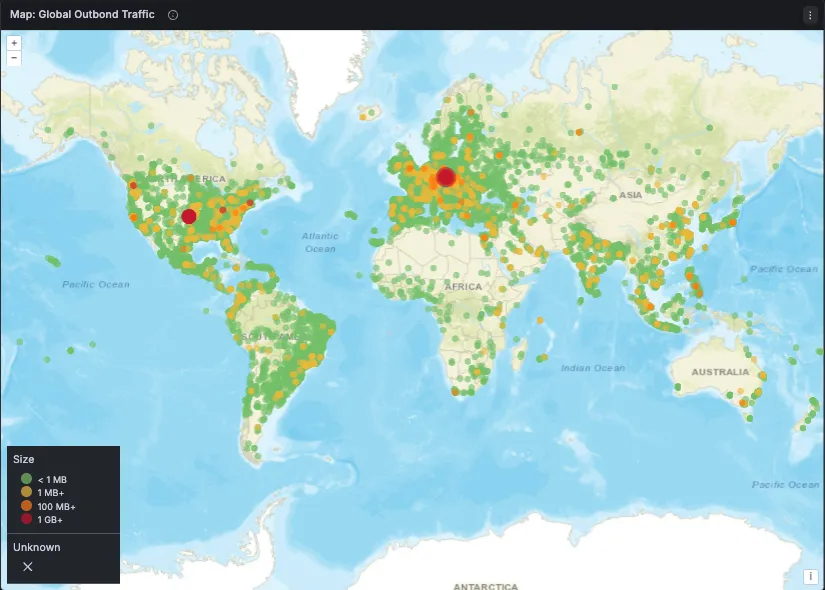
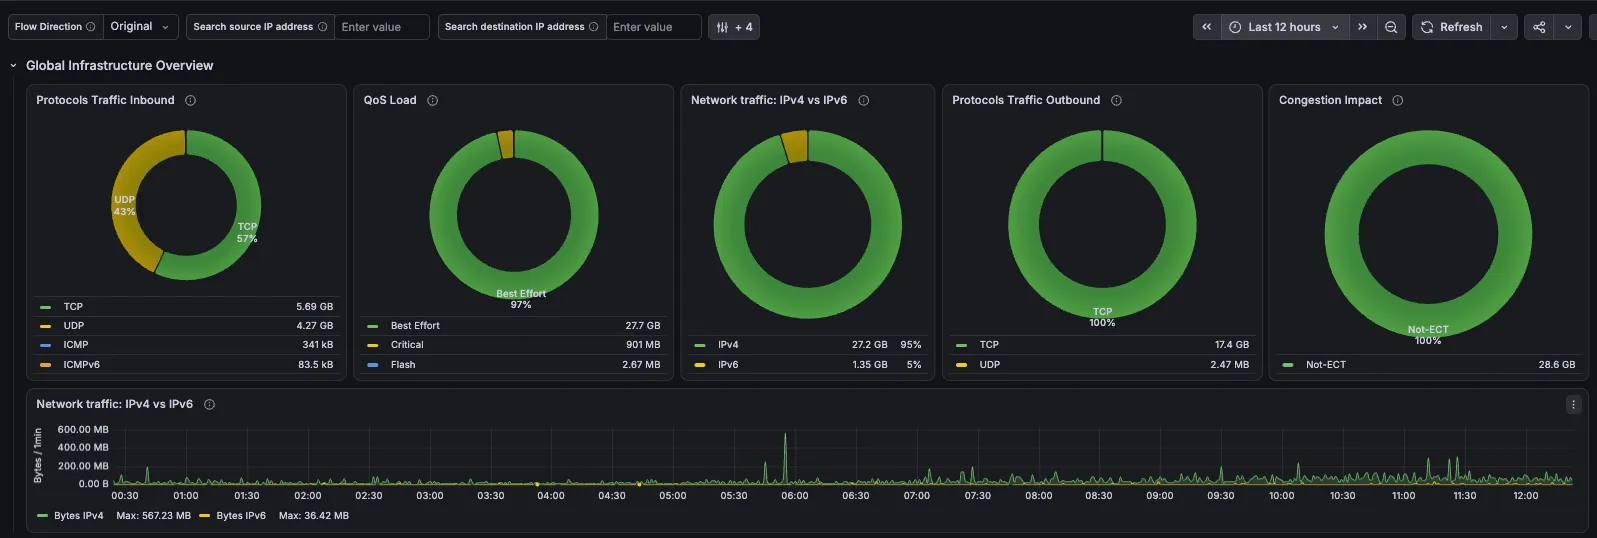
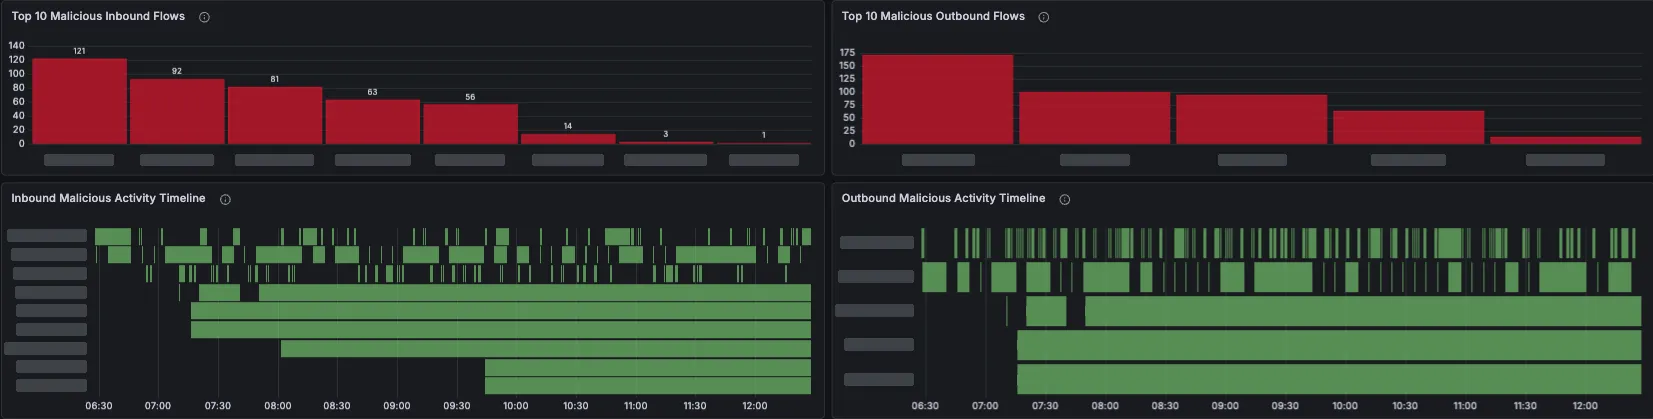
  • Dashboards. Grafana comes with a provisioned datasource and a Network Security Overview dashboard: scan, brute-force and flood heuristics, spoofing checks, and a filterable flow table.
  • Demo mode. Synthetic, privacy-safe traffic (documentation IP ranges only), so anyone can try the stack locally.
  • Operations. Runs on a single host. Versions are pinned, secrets are only in .env, ClickHouse and Grafana are bound to localhost, and data is kept for 3–4 months.

Demo edition and production deployment

The repository on GitHub is a demo edition under the MIT licence. It is meant for trying the stack and seeing how it works, with synthetic traffic.

Running it on a real network needs more: sizing for your traffic and retention, onboarding of your exporters, access and security settings, detection tuned to your network, and someone who keeps it running. That is what I do for clients. On top of that I extend the stack with GeoIP/ASN enrichment, multiple exporters, alerting and pre-aggregated statistics.

Architecture

Flow records travel from the exporter (or the demo generator) through the collector into ClickHouse, where Grafana reads them.
Components

Select a component to see what it does, or send a flow through the stack.

Router / switch

Any network device that can export IPFIX or NetFlow. It sends flow records over UDP 4739 to the collector. It is your device, not part of the stack.

Traffic generator

Used in demo mode instead of a real router. It generates synthetic traffic from documentation IP ranges, so anyone can try the stack without a real network.

IPFIXcol2

The collector. It receives IPFIX over UDP 4739, decodes the records and passes them on to ClickHouse.

ClickHouse

Stores the flow records and enriches them at insert time. Bound to localhost only. Data is kept for 3–4 months.

Enrichment

Each flow gets protocol names, traffic direction (internal, inbound, outbound), QoS priority, ECN and readable TCP flags. Try it in the demo below.

Grafana

Provisioned datasource and the Network Security Overview dashboard with scan, brute-force and flood heuristics, spoofing checks and a filterable flow table. Bound to localhost only.

Try it

Small demos with synthetic data. They show what the stack does with flow records; in the real stack this work is done by ClickHouse and Grafana.
A flow record before and after enrichment

A router exports numbers. At insert time ClickHouse turns them into readable values. Pick a sample and switch the enrichment on. Click a field name for an explanation.

Sample flow: HTTPS
IPFIX fieldRaw valueEnriched
sourceIPv4Address192.0.2.15—
destinationIPv4Address

Direction is decided by comparing both addresses with the internal network (in this demo 192.0.2.0/24).

203.0.113.80direction: outbound
sourceTransportPort51544—
destinationTransportPort443—
protocolIdentifier

IANA protocol number: 6 is TCP, 17 is UDP, 1 is ICMP.

6TCP
tcpControlBits

All TCP flags seen in the flow, as one number. 27 (0x1B) = FIN, SYN, PSH, ACK: a complete short connection. A lone SYN (2) is only a connection attempt.

27 (0x1B)FIN · SYN · PSH · ACK
ipClassOfService

The upper 6 bits are DSCP (QoS priority), the lower 2 bits ECN. 184 = DSCP 46 (EF), typical for voice.

0QoS: CS0 (best effort) · ECN: Not-ECT
packetDeltaCount12—
octetDeltaCount4821—
Sample flow: SSH
IPFIX fieldRaw valueEnriched
sourceIPv4Address198.51.100.23—
destinationIPv4Address

Direction is decided by comparing both addresses with the internal network (in this demo 192.0.2.0/24).

192.0.2.10direction: inbound
sourceTransportPort40112—
destinationTransportPort22—
protocolIdentifier

IANA protocol number: 6 is TCP, 17 is UDP, 1 is ICMP.

6TCP
tcpControlBits

All TCP flags seen in the flow, as one number. 27 (0x1B) = FIN, SYN, PSH, ACK: a complete short connection. A lone SYN (2) is only a connection attempt.

2 (0x02)SYN
ipClassOfService

The upper 6 bits are DSCP (QoS priority), the lower 2 bits ECN. 184 = DSCP 46 (EF), typical for voice.

0QoS: CS0 (best effort) · ECN: Not-ECT
packetDeltaCount1—
octetDeltaCount60—
Sample flow: VoIP (RTP)
IPFIX fieldRaw valueEnriched
sourceIPv4Address192.0.2.31—
destinationIPv4Address

Direction is decided by comparing both addresses with the internal network (in this demo 192.0.2.0/24).

192.0.2.45direction: internal
sourceTransportPort16384—
destinationTransportPort16402—
protocolIdentifier

IANA protocol number: 6 is TCP, 17 is UDP, 1 is ICMP.

17UDP
tcpControlBits

All TCP flags seen in the flow, as one number. 27 (0x1B) = FIN, SYN, PSH, ACK: a complete short connection. A lone SYN (2) is only a connection attempt.

0 (0x00)not TCP
ipClassOfService

The upper 6 bits are DSCP (QoS priority), the lower 2 bits ECN. 184 = DSCP 46 (EF), typical for voice.

184QoS: EF (expedited) · ECN: Not-ECT
packetDeltaCount900—
octetDeltaCount172800—

Synthetic data. Addresses are from documentation ranges (RFC 5737).

Traffic and detection simulator

Pick a scenario. The simulator generates one minute of synthetic flows and checks them with simplified versions of the heuristics from the Network Security Overview dashboard.

Flows per second

Detection rules

RuleValueThresholdStatus

Latest flows

sSourceDestinationPortProtoTCP flagsPackets

Simplified illustration with synthetic data (RFC 5737 addresses). Real thresholds are tuned to each network.

Dashboards and insights

Tech stack

IPFIXcol2
Collector. Receives IPFIX over UDP 4739 from routers and switches.
ClickHouse
Stores the flow records and enriches them at insert time.
Grafana
Provisioned datasource and the Network Security Overview dashboard.
Traffic generator
Built-in source of synthetic, privacy-safe traffic for demo mode.
Docker Compose
Runs the whole stack on a single host with pinned versions.
  • Network monitoring deployment

    I deploy the IPFIX/NetFlow monitoring stack in your infrastructure or in the cloud and connect your routers and switches to it.

  • Extensions and custom dashboards

    I extend the monitoring stack for your network: GeoIP/ASN enrichment, more exporters, tuned detection, alerting and custom dashboards.

  • Maintenance and support

    I keep your monitoring running: updates, checks of storage and retention, and help when something stops working.

Need help with your network or monitoring?

Send me a short description of your network and what you need.